“Zero Tailpipe Emissions” Is Not the Whole Story
If you’ve been tracking the electric vehicle wave in India, you’ve probably heard the same magic phrase in every ad: “Zero Tailpipe Emissions”. It’s a great hook, but it quietly skips over the most important variable in the entire climate equation.
Here’s the honest truth: Your EV is only as clean as the power grid charging it.
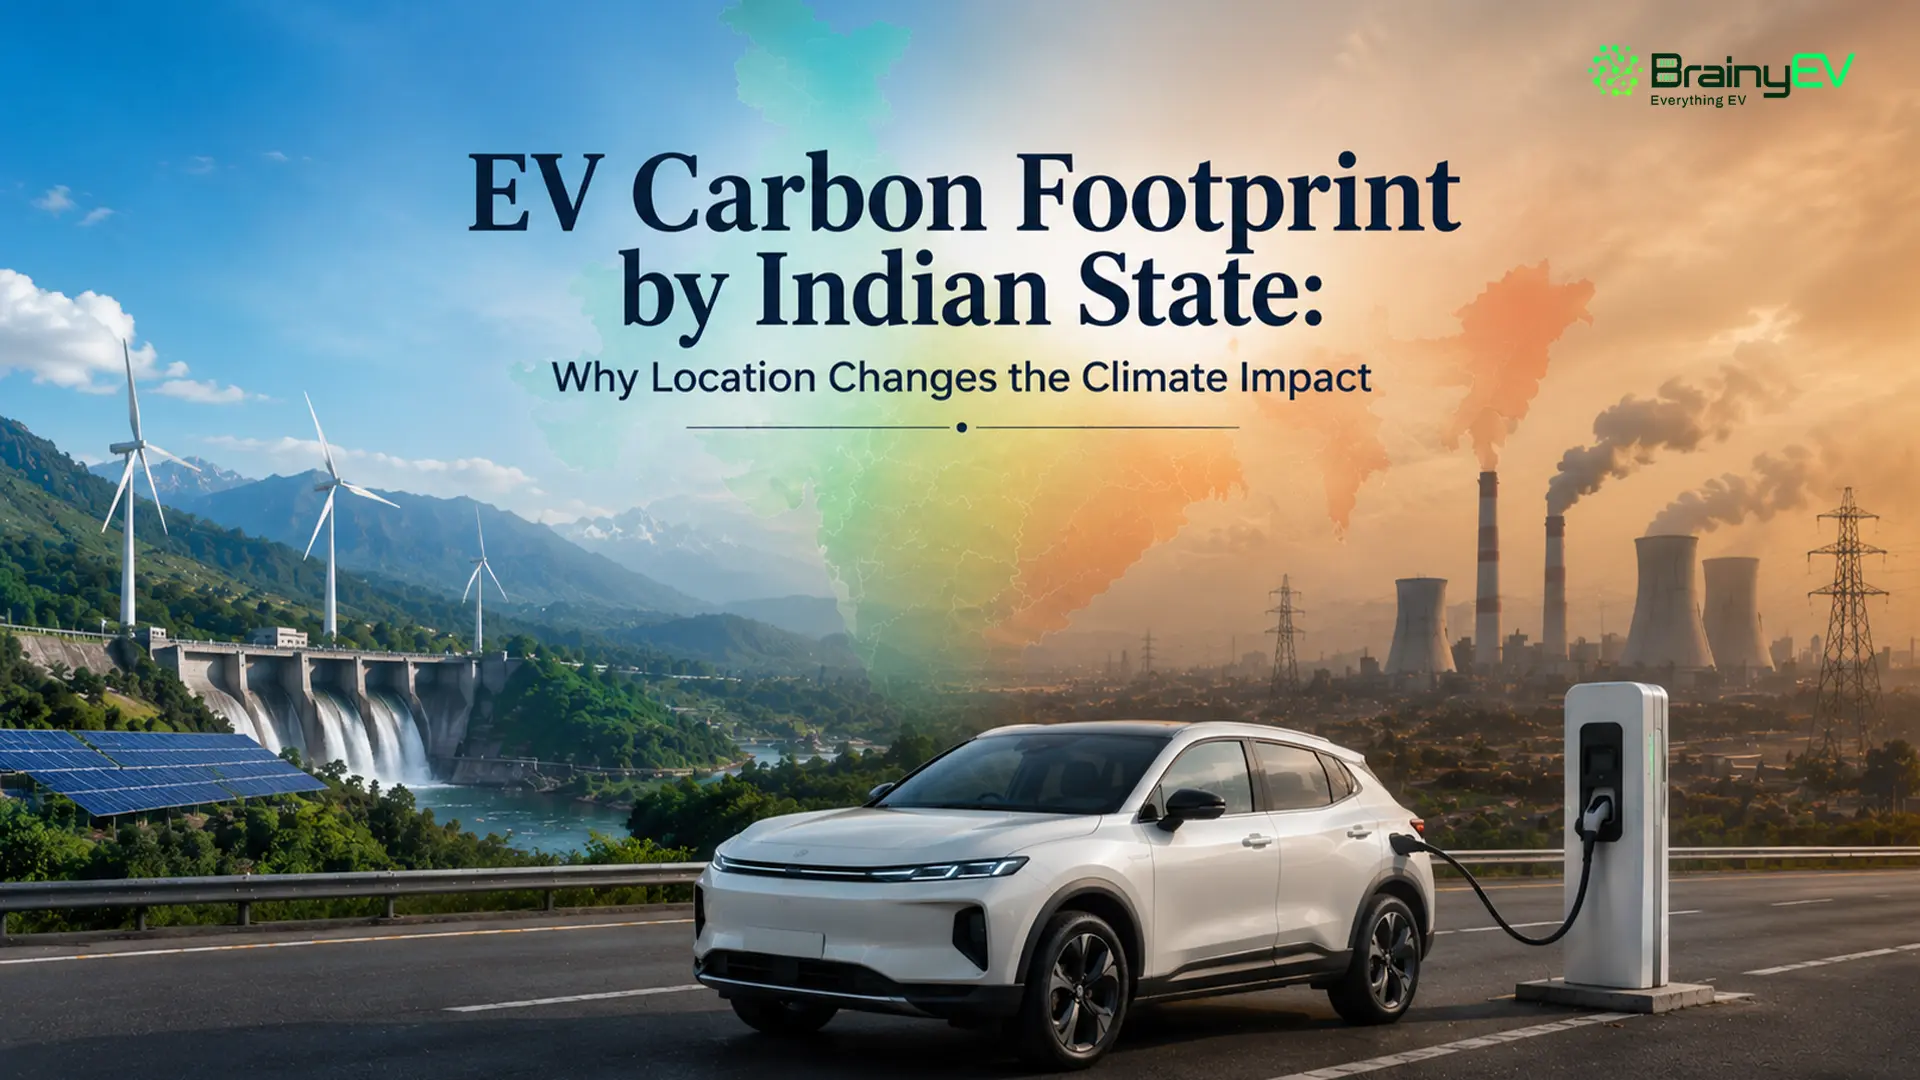
India generates electricity very differently from state to state. That means the same EV model, parked in Shimla versus Dhanbad, will have a meaningful electric vehicle’s carbon footprint per kilometre. If you’re a buyer, a fleet operator, or just someone trying to do the actual EV lifecycle emissions environmental math, a single national average will mislead you.
Let’s cut through the marketing and look at the real, state-by-state picture of EV carbon emissions in India.
What Creates an EV’s Carbon Footprint?
To understand why location matters so much, you have to look beyond the tailpipe. An EV’s true lifecycle carbon footprint comes from two primary phases:
- Manufacturing Emissions – The Carbon Debt
Building an EV, particularly its lithium-ion battery, is energy-intensive. A factory-fresh EV starts its life carrying more embedded carbon than a comparable petrol car. According to the International Council on Clean Transportation (ICCT), this manufacturing carbon debt is typically paid off within 2 years of average driving, and drops to about 18 months if you charge with renewable energy.
That’s not a deal-breaker. It’s just the starting line.
- Charging Emissions – The Location Variable
This is where your daily driving life plays out. Every kilowatt-hour (kWh) you push into your car carries embedded emissions from whatever power plant generated it. On a coal-heavy grid, that’s a heavier footprint per km. On a solar- or hydro-dominated grid, it’s dramatically lighter.
A 2025 meta-analysis by IIT Roorkee and ICCT found that EVs in India emit 14-38% less CO₂ equivalent over a 150,000 km lifetime than ICE vehicles, even accounting for battery manufacturing and India’s current coal-heavy grid. The range is wide because the grid is not uniform. And that’s exactly the point of electric vehicles lifecycle emissions and EV life cycle assessment.
What about battery recycling?
India’s battery end-of-life ecosystem is still developing, with players like Attero and Lohum building out recycling infrastructure. As this scales, end-of-life emissions from EVs will continue to fall, but it’s not yet a deciding factor for most buyers.
So when people ask whether EVs are truly “zero carbon,” the accurate answer is: no, but they’re the lowest-carbon option available, and that advantage grows with every solar panel India installs.
India’s Grid Is Not One Grid: The State-Level Reality
India does not run on a single, uniform power system. The carbon intensity of electricity varies significantly across state lines, by a factor of 3-5x, depending on local generation assets.
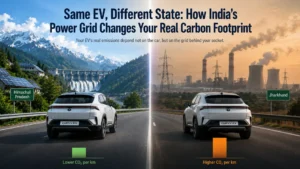
Picture two identical electric SUVs:
- EV A, charged in Karnataka (37% renewable procurement, strong solar + hydro mix) – low upstream footprint
- EV B, charged in Jharkhand (roughly 8% renewable penetration, predominantly coal) – higher upstream footprint
Both have zero tailpipe emissions. Both are mechanically identical. But EV A’s per-kilometre carbon footprint is substantially lower because the electricity in its battery came from a cleaner source.
The National Average – And Why It Doesn’t Tell Your Story
According to the CEA CO₂ Baseline Database V21.0 (November 2025), the all-India weighted average grid emission factor is 0.7117 tCO₂/MWh for FY 2024–25 , down from 0.774 tCO₂/MWh in FY 2013-14. That’s an 8% reduction over a decade, driven almost entirely by renewable energy growth.
But that national number masks enormous state-level variation. Here’s where the picture gets personal.
Location dictates your entire EV experience, from grid intensity to public charger access. Head over to the BrainyEV Finder to discover, filter, and compare the exact EVs, cars, bikes, or commercial vehicles optimised for your state’s layout.
State-Wise EV Climate Advantage: 2026 Data
The table below maps India’s major states against their current grid character and what it means for your EV’s real climate impact. State-level emission intensity figures are approximations based on generation mix data (CEA does not publish per-state emission factors directly; regional grid factors computed from V21.0 plant-level data show Eastern grid at (~0.928 tCO₂/MWh) vs North-Eastern at (~0.429 tCO₂/MWh).
| State | Grid Character (2026) | Renewable Share (Approx.) | EV Climatez Advantage |
| Himachal Pradesh | Hydro-dominant | ~65% | Exceptional – India’s lowest emission intensity; hydro generates 70%+ of state power |
| Uttarakhand | Hydro-heavy | ~44% | Very High |
| Karnataka | Solar + Wind + Hydro | ~37% | Very High – leads large states in lowest power sector emission intensity (IEEFA SET 2026) |
| Rajasthan | Solar-dominant | ~72% RE share in installed capacity | High – first state where solar crossed 50% of installed capacity, 41.7 GW solar as of April 2026 |
| Gujarat | Solar + Wind | ~57% | High – leads India’s overall RE installations at 49.1 GW |
| Tamil Nadu | Wind + Solar | ~58% | High – wind energy leader with 12,159 MW |
| Kerala | Hydro + Solar | ~Moderate-High | Moderate-High – low emission intensity, strong hydro base |
| Maharashtra | Mixed | ~Moderate | Moderate |
| Uttar Pradesh | Coal + Growing Solar | Low–Moderate | Moderate – strong EV adoption momentum but grid still transitioning |
| West Bengal | Predominantly Coal | ~7% | Lower advantage – only 7% renewable share in procurement (FY2024) |
| Jharkhand | Predominantly Coal | ~8% | Lower advantage – but still better than any petrol car |
| Chhattisgarh | Coal-dominant | ~10% | Lowest advantage among major states – 90%+ coal-based procurement |
Even in the lowest-advantage states like Jharkhand and Chhattisgarh, EVs still produce significantly lower lifecycle emissions than petrol vehicles. The climate advantage isn’t erased, it’s just smaller. And as India’s grid cleans up, it grows automatically.
The Real Numbers: A Two-State Comparison
Here’s what the state divide looks like in practice. Take a mid-size EV consuming approximately 15 kWh per 100 km, driven 15,000 km per year:
- In Himachal Pradesh (hydro-dominant, low emission intensity): annual charging emissions approach the very low end of India’s EV range, far below any petrol or diesel equivalent.
- In Jharkhand (coal-heavy, ~8% renewable): annual charging emissions are higher, but a petrol car still emits 0.13-0.20 kg CO₂ per km just from its exhaust, before even accounting for the fuel supply chain.
The gap between these two scenarios is real and significant. It also explains why choosing an EV with strong battery efficiency and real-world range matters more in coal-heavy states, every kWh you save in consumption is a direct emissions saving.
When Does an EV Deliver Maximum Climate Payoff?
An EV’s environmental benefit scales based on your specific situation. Four conditions unlock peak climate value:
| Condition | Why It Matters |
| High Annual Mileage | Spreads the manufacturing carbon debt over more kilometres, pays it off faster |
| Clean State Grid | Minimises CO₂ generated per charge cycle |
| Home Solar Integration | Bypasses the thermal grid entirely during daylight hours |
| Long Ownership Period | More years benefiting as the grid decarboniser around you |
Use the BrainyEV Cost Calculator to map your cost-per-km savings and total emissions impact based on your actual driving profile and home state.
The Silver Lining: India’s Grid Is Cleaning Up Fast, and Your EV Benefits Automatically
Here’s the most underrated fact about EV ownership in India right now.
A petrol or diesel car is locked into its emissions profile the day it rolls out of the factory. As the engine ages, efficiency drops and emissions inch up.
An EV works in reverse. It’s the only vehicle on the road that automatically becomes cleaner the longer you own it.
And India’s 2026 numbers make this point harder to ignore than ever:
- India achieved a total non-fossil capacity addition of 55.3 GW in FY 2025-26, the highest annual increase ever recorded. In July 2025, renewable energy met 51.5% of India’s total electricity demand of 203 GW, for the first time ever.
- India crossed the 150 GW milestone with cumulative installed solar capacity of 150.26 GW as on 31 March 2026, a 53x increase from just 2.82 GW in 2014.
- Coal-based generation in India declined by 3.69% in FY 2025-26, a structural shift is underway.
Every solar panel and wind turbine commissioned makes the electricity in your charging port a little cleaner. You don’t need to upgrade your car. The grid does the work.
India’s EV Market in 2026: The Momentum Is Here
This isn’t a future story, it’s happening now. India’s EV industry penetration in overall automobile sales rose to 8.27% in FY2026 (of 29.63 million vehicles), up from 7.52% in FY2025. Monthly retail sales surpassed 200,000 units five times in FY2026 and hit a new high of 280,093 units in March 2026.
Uttar Pradesh, Maharashtra, Karnataka, Tamil Nadu, and Rajasthan were the leading EV markets in FY2026, collectively accounting for nearly 50% of cumulative EV sales.
The market has tipped. The question is no longer whether to go electric, it’s which EV makes the most sense for your state, your grid, and your driving life.
Navigating Your Choice on BrainyEV
The real climate math of EV ownership in India isn’t in the marketing. It’s a personalised calculation built on your location, your state’s power grid, and your driving habits.
Whether you’re pairing a long-range commuter with a rooftop solar setup, or looking for an efficient city ride suited to your local infrastructure, the specs that matter most (battery capacity, real-world range, charging speed) vary by use case and state. BrainyEV gives you the tools to compare those specs across every EV available in India, so your decision is grounded in data, not slogans.
Ready to find the EV that makes the most sense for your home state? Explore on BrainyEV today.